Automated performance trends
Published: 2011-05-19 by Lars testingperformance
We used to have several automated performance tests on one of our larger development projects. But we got a lot of false negatives: the tests were failing only occasionally meaning the problem was in the environment, not in the software itself. While we try to ensure that the server is undisturbed during a performance test run, unanticipated load from automated software updates or somebody remote desktop'ing to the server might inject additional load. With 20 tests chances were high that in each test run, one of them would randomly fail, causing the entire build to fail, and often delaying deployment unnecessarily.
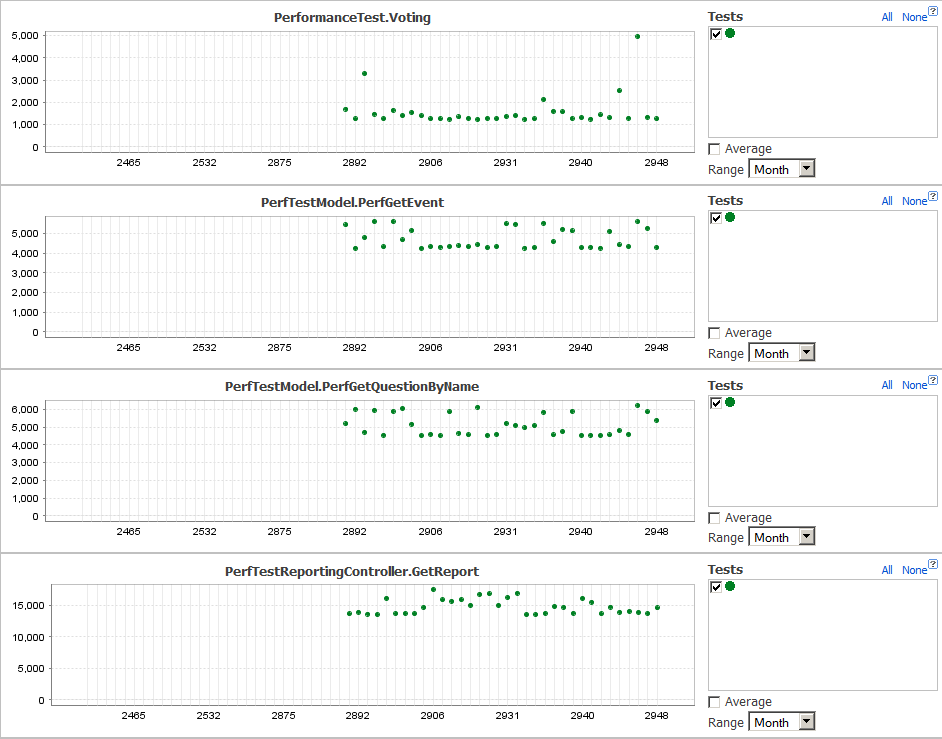
Now we produce performance trend lines instead. This has introduced a 10 second manual step in the deployment procedure where we verify the trend lines. Below is an excerpt of the output from the build process:
Our previous performance tests were following this pattern: The test code would repeat some operation for a specific amount of time (say 2 seconds) and measure the resulting number of iterations. This number was then compared with an expected interval, and if the number was outside that interval the test would fail. For a long time we took to adjusting (often expanding) the interval when some test failed more often than not.
Finally we realized that asserting some number to be within a fairly large and relatively arbitrary interval is not much of an assertion. So we decided to change the strategy.
Now we have rewritten the tests to run a fixed number of iterations and measuring the time it takes to run each test (excluding the time to perform setup before the test). We then output the number of milliseconds to a file marked up in a way that our build server (TeamCity) can use for generating the trend curves.
As you can see there are occasional spikes on the curves reflecting the disturbances in the environment.
Before deploying a new build, just a glance at the performance trend curve now shows us if the build is good to deploy. In spite of 10 seconds extra manual work, this process is much more smooth than before.
If you are interested in the details, our setup involves modifying our performance test framework to generate a teamcity-info.xml file in the root of the workspace containing the data points, looking like this:
<build>
    <statisticValue key="PerfTestVoteController.Vote.Duration" value="583"/>
    .
    .
</build>
To convert these data points into graphs, we have added the following configuration to the TeamCity file (TeamCity Data Directory)/config/(project_name)/plugin-settings.xml (our TeamCity Data Directory is in C:\Users\Administrator.BuildServer):
<graph title="Vote" hideFilters="showFailed" seriesTitle="msec for X iteration">
    <valueType key="PerfTestVoteController.Vote.Duration" title="PerfTestVoteController" buildTypeId="bt4"/>
</graph>
valueType/@key must match statisticValue/@key from the teamcity-info.xml file. The value of buildTypeId can be found in the URL when browsing the project on the TeamCity server.
After setting this up, the graphs are available by selecting the project (not an individual build configuration) and then clicking on the statistics menu item.
(Updated with more details April 2012, thanks Henrik!)